ADBRI’s Dog Park monitor is set up to measure the amount of dust (PM10/PM2.5) in the community.
The monitor’s in a residential area, about 100m from ADBRI’s Birkenhead plant and about 50 m from Victoria Rd.
According to the National Pollutant Inventory, the Birkenhead plant is the largest dust source in the metro area, and DIT data shows that section of Victoria Rd is it’s busiest ( 32,100 vehicles per day 12% commercial vehicles).
That sounds like a fair bit of dust, without even considering all those excited pooches scampering around the monitor.
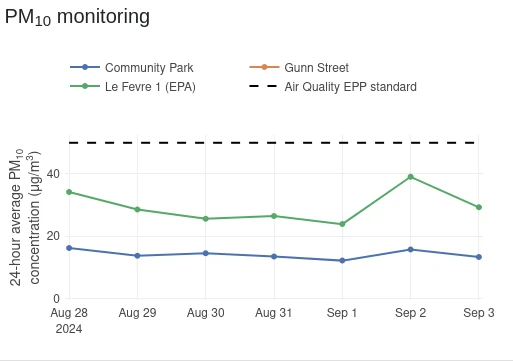
Well not in the last week or so according to this image from the ADBRI website

The EPA monitor is at LeFevre Primary school, only 700m away.
The EPA say readings from that monitor are the same as the rest of the metro area ( PAREPG’s view is different, but that’s another story)
So the dog park dust was about half the rest of the metro area that week??
But wait, there’s more
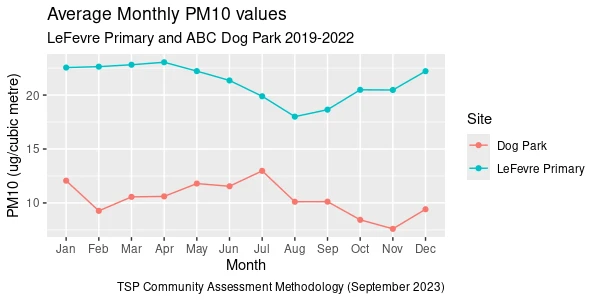
A recent ADBRI report showed average monthly dust measurements over three years (2019-2022) .

Has there really been less dust next to the plant than in the rest of the Metro area since 2019- or maybe even earlier?
ADBRI suggests the monitors are different type!
And they are – but publicly reporting incorrect levels without comment is just plain misleading.
People have a right to know the amount of dust they are exposed to, and how that compares to regulatory limits.
PAREPG has trawled through many of ADBRI’s reports to the EPA where this pattern is continued and can find no mention of the numbers reported being qualified in any way.
The EPA routinely accepts ADBRI’s reports every quarter, and presumably finds this behavior acceptable.
We dont!
