The Department has made much of the suitability of the Semaphore to Taperoo beaches for sand mining. But as time passes, cracks are starting to appear in that suitability.
Putting aside the voluminous Departmental propaganda for the moment, the basis of these claims rested on Departmental data and specialist consultant reports.
Water Technology produced the Impact Assessment of Moving Sand from Adelaide’s Northern Beaches – Phase 1 Assessment: 2020-2021 Sand Movement in October 2020. The “Phase 1” report was produced to investigate the mining of “emergency” sand prior to pipeline construction. The report found the Department’s
suggested quantities of the three scenarios of maximum 35,000 m3 and 50,000 m3 for the area in between Semaphore and Largs Jetty and North of Largs Jetty respectively are acceptable.
The Department subsequently mined 20,000 m3 from between the jetties and 27,000 north of the Largs Jetty in 2020/21
A second report, Impact Assessment (Phase 2) of Moving Sand from Adelaide’s Northern Beaches to consider pipeline impacts was written in July 2021. The phase 2 report queried the basis of the phase 1 report, questioning estimates of the location of the dune face, used to inform it’s recommendations:
Water Technology reported that they considered the movement of the “front face of the dune”; it appears that this may have been determined by inspection as their study report does not seem to indicate how the location of the front face was defined.
Those of us who were on the ground and followed the progress of the phase 1 report can confirm it was a desktop study, produced during a time of COVID restrictions and that no on-ground work occurred. So just how these estimates were produced remains unknown.
The phase 2 report also considered the Digital Earth Australia Coastlines dataset to examine coast line changes. This dataset uses contouring methods and LANDSAT satellite data to estimate shoreline changes across Australia. The report found:
that the shoreline between Semaphore and Largs Jetties has been relatively stable over the past 10 years. This is also reflected in our analysis of Profile 200004 in Table 4, where the surveyed front of the foredune (represented by the 2m AHD contour) has only moved +/- 2m over this period with no clear trend.
The phase 2 report went on to recommend sand could be mined immediately north of the Semaphore Jetty. As considered in our previous post, that area suffered sufficient erosion to impact some of the best vegetation identified on this section of the coast.
The Department has supplied us with profile data for the Semaphore jetty, Kanowna Rd and the Largs Bay jetty. As previously mentioned, the Largs Bay jetty profile can’t be used. Examining the Department’s data for profiles at the Semaphore jetty, and Kanowna Rd reveals some interesting insights:
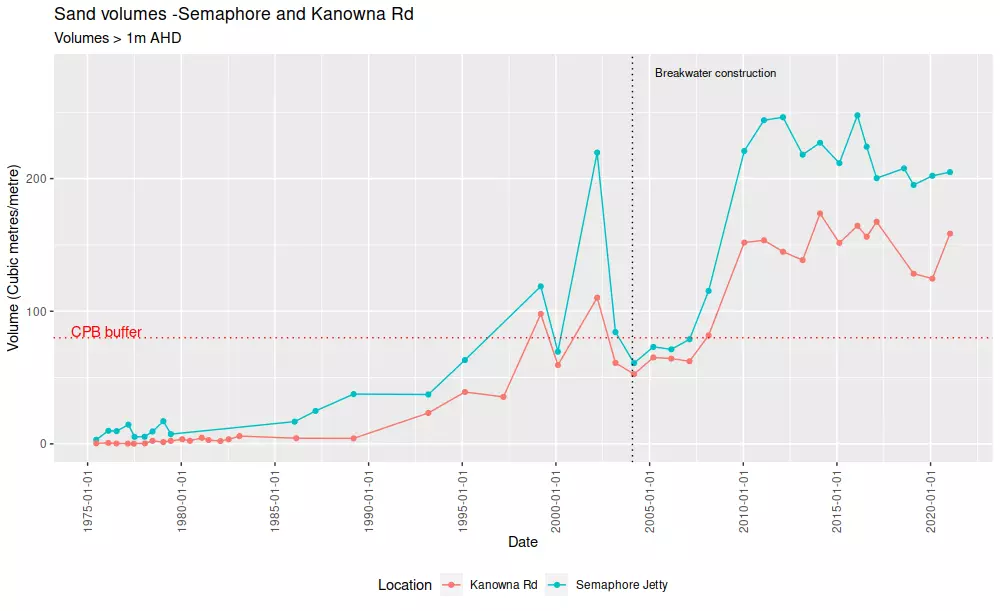
- Prior to about 2000 local infrastructure was at risk as buffer levels were significantly below the Coast Protection Board’s recommended 80 m3 per metre. threshold.
- In the early 2000’s wild volume gyrations started. Currently we don’t have enough profiles to determine the reason, but it is possibly due to replenishment works at Semaphore Park.
- 2004 saw the start of construction of the Point Malcolm breakwater. After construction an unprecedented volume increase occurred at both the jetty and Kanowna Rd. We believe the most likely explanation is the erosion of the downstream side side of the breakwater at Semaphore South.
- Stored sand volumes have been generally decreasing since the peak of that release.
- Water Technology’s report was based on data on the 10 years from 2010-20. In other words their data and conclusions were based on the anomalous sand volumes generated by the Semaphore South erosion.
Our conclusion is that the best available evidence shows the beach between the Semaphore and Largs Bay jetties has been stable, or more likely decreasing in volume over the 2010-21 decade. The major source of sand in this area appears to be scouring at Semaphore South caused by the Point Malcolm breakwater.
It appears that the Department has either been less than forthright in it’s communications with local residents, or it genuinely doesn’t know or care what’s really happening at Semaphore.